Program Execution Efficiency
To significantly boost a program's execution efficiency, the primary step is to select efficient algorithms. If the chosen algorithm inherently lacks efficiency, no amount of code optimization can compensate for that deficiency. However, once the algorithm is set, optimizing the code can maximize the program's efficiency.
Identifying Performance Bottlenecks
The key to enhancing a program's efficiency lies in pinpointing the bottlenecks that hamper its performance. According to the 80/20 rule applicable to LabVIEW programs, about 20% of the code consumes 80% of the execution time. Targeting and optimizing this critical 20% can yield disproportionately large efficiency gains.
For programs already in development, the Performance and Memory Profiling Tool can help identify how long each VI takes to run. Optimizations should focus on the most time-consuming VIs identified by this tool. Accessible via "Tools -> Profile -> Performance and Memory" in LabVIEW, this tool tracks CPU usage and memory allocation for each sub-VI during execution.
Here’s a brief guide to using the tool: Before running the program, activate the "Start" button on the tool's interface to begin monitoring all VIs in memory. After the program concludes, clicking the "Snapshot" button will sort and display each sub-VI by "VI Time" in descending order, highlighting which sub-VIs consumed the most CPU time. These are the bottlenecks and thus, the prime candidates for optimization.
A sub-VI’s significant CPU time might indicate complex internal computations, necessitating a closer look and possible optimization of its algorithm. More often, however, it suggests the sub-VI is executed excessively. In such cases, reevaluating the program's structure to reduce the execution frequency of these VIs may be beneficial—whether by removing them from unnecessary loops or by segmenting their code to isolate parts that don't require repeated execution.
Not all issues related to execution efficiency will be visible in the Performance and Memory tool. It only tracks CPU time consumed by VIs. Thus, inefficiencies due to unnecessary delays or operations that block program execution (like slow I/O operations or network data transfers) won't be reflected in this tool. Similarly, significant CPU-consuming operations not directly associated with VIs, such as thread switching or memory allocation, though impactful, won't be captured. To fully understand these program segments' execution times, alternative analysis methods must be employed.
Measuring Code Execution Time
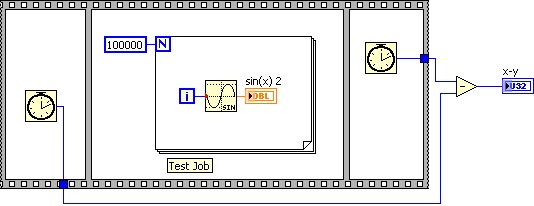
When debugging or testing a program, sometimes the main concern is how long a specific section of code takes to execute. This refers not to the CPU time consumed, but to the actual elapsed time from start to finish of the program's execution. This task can often be accomplished by writing a straightforward script. Utilizing a sequence structure, one can record the current time just before the program segment starts and again immediately after it concludes. The difference between these two times represents the execution duration of that program segment. This approach has been frequently utilized in examples throughout previous chapters:

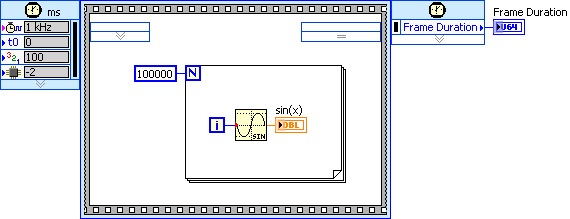
Alternatively, a simpler method involves using a single timing sequence structure. For instance, in the example shown below, the "Frame Duration" output serves a similar purpose as the x-y calculation in the previous illustration.

Both methods have a maximum precision of 1 millisecond, making them unsuitable for measuring shorter durations. It's important to note that employing a timing structure might alter the thread in which the enclosed code runs, potentially impacting the measured execution time.
On computers equipped with multi-core CPUs, programs can execute concurrently across several CPU cores. Some sub-VIs, although consuming significant CPU time, can be executed without affecting the overall program efficiency if the program's threading is properly managed.
Addressing Performance Bottlenecks
The Performance and Memory Profiling Tools alone may not capture all potential efficiency issues within a program. Furthermore, making substantial modifications to a program after its primary development phase can be costly, especially when such changes involve restructuring. This may necessitate updates to dependent code and retesting, introducing risks and delays. Consequently, the most effective strategy for enhancing program performance involves considering all potential efficiency factors during the design phase, rather than retrospectively identifying and resolving bottlenecks.
Understanding common sources of inefficiency can aid developers in swiftly pinpointing issues during the debugging process. The sections below discuss areas in code that commonly lead to reduced performance. These potential bottlenecks deserve careful consideration during the program design process to prevent efficiency issues.
Reading and Writing to Peripherals and Files
Compared to the processing and memory read/write speeds of a computer's central processing unit (CPU), the data handling and transmission speeds of peripheral devices are notably slower. For example, the GPIB's maximum transfer rate is only 1Mbps, which is significantly lower than the memory's transfer rate by more than two orders of magnitude. In test application software, the bottleneck causing overall system inefficiency is likely due to these types of data transfers: most of the program's execution time is spent waiting for external data.
These devices' speeds cannot be improved by optimizing the program. However, one approach to mitigate this issue is to perform other computations in parallel with reading and writing to peripherals or files. This way, these operations do not unduly delay the program's overall execution.
Another method to enhance program efficiency is by optimizing the program structure to reduce the number of accesses to peripherals and files. For instance, consider a program that writes ten thousand strings to a file sequentially:
This code is extremely inefficient, primarily due to the opening and closing file operations, which are performed ten thousand times. Running this code on my computer takes over 2 seconds. However, it is completely unnecessary to open and close the file with each write operation. Instead, the open and close operations can be placed outside the loop, as shown below:
With optimization, the same file-writing operation now only takes 60 milliseconds. In this program, the file-writing operation was executed ten thousand times. Since the operating system optimizes file writing, not every call to this function truly writes data to the disk; it is often the case that the data is actually written to the disk only upon closing the file. Nonetheless, this program can be further optimized to minimize the number of writing operations:
In the optimized version shown above, all file operation functions are invoked only once. Executing this code requires only 30 milliseconds.
Interface Refresh
Refreshing the user interface consumes a significant amount of computational resources. Moreover, excessively frequent refreshes don't benefit users; an interface element needs to be visible for at least several hundred milliseconds for users to clearly see it. For example, updating a numeric control on the interface at a high frequency, such as one hundred times per second, results in rapid flickering, making it impossible for users to read the displayed data. Thus, the frequency of interface refreshes should be reduced to an appropriate level to decrease the computational load.
Consider a scenario where data is collected and displayed on the interface in waveform format. Suppose the program reads data from the data acquisition device at a rate of 1000 times per second, collecting 20 data points each time. It's unnecessary to refresh the display after each data collection. Instead, refreshing the screen every 0.1 seconds, after every 100 collections, is sufficient. Moreover, when refreshing the screen, displaying all 2000 newly collected data points isn't necessary. Given that users cannot absorb the details of 2000 data points while the program runs, resampling these 2000 data points to represent them with just 10 data points is more practical.
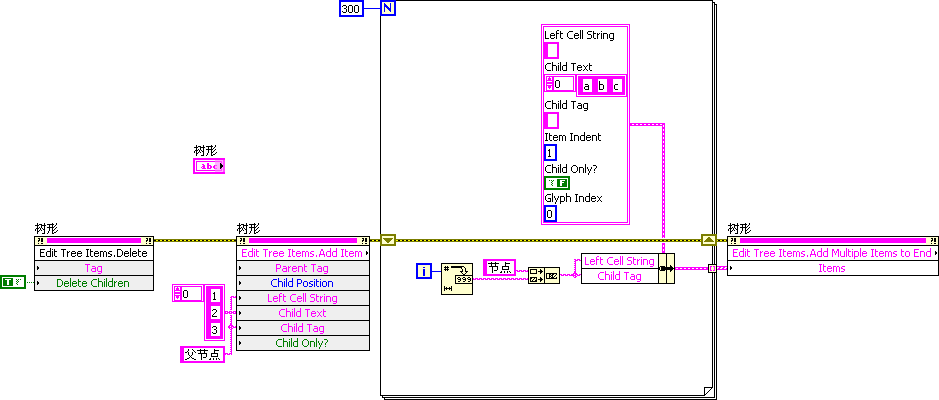
Some interface refreshes may not be intentionally set by programmers during development. For example, the following program is designed to display multiple messages in a "Tree" control, consisting of a main entry and 300 sub-entries.

The program includes a loop that iterates 300 times, adding an entry to the tree control with each iteration. During execution, each addition of an entry triggers a refresh of the property interface. Since refreshing the tree control is relatively slow, this program is highly inefficient. Fortunately, the tree control offers a method to pass all entries to be added at once. By doing so, the tree control needs only to refresh once during program execution, significantly improving efficiency. The optimized program's block diagram is as follows:

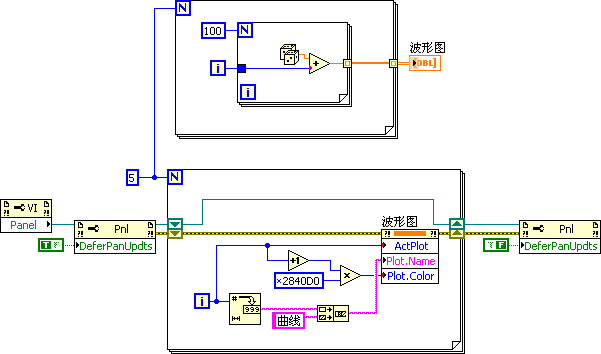
Some controls don't offer a method like that of the tree control for changing all data at once. For instance, if a program needs to modify the properties of each curve on a waveform graph control, it must use a loop, modifying one curve's properties with each iteration. However, each modification of the waveform graph curve's properties automatically triggers a refresh of the waveform graph. These unnecessary refreshes use up significant computational resources. A workaround for reducing the number of interface refreshes in such cases involves using the VI front panel's "Defer Panel Updates" property. By setting this property to "True" before executing code that updates the interface, updates are postponed during the code execution. After all update operations are complete, setting "Defer Panel Updates" to "False" allows the VI to update the interface once for all preceding operations, greatly enhancing program efficiency:

Loop Computations
When designing loops, extra caution is essential. Even if a code snippet runs quickly on its own, if it's executed thousands, millions, or even more times, the time consumed can become significant. Thus, the efficiency of the code inside a loop has a greater impact on the overall performance the more frequently the loop is executed. An example discussed in the previous section on reading and writing peripherals and files shows how moving code that can reduce call frequency outside of the loop can improve program efficiency.
Similarly, operations on hardware devices can encounter comparable issues. A test program may need to set or read data from instruments or data acquisition devices multiple times. However, operations to open and close hardware devices should not be repeated multiple times; instead, all hardware devices should be opened at the start of the test program and closed at the end.
The program below illustrates a common pitfall for LabVIEW beginners, especially those with experience in textual programming languages, who tend to store the result of each loop iteration in a variable, then read the value from the same variable in the next iteration.
In LabVIEW, reading and writing to global or local variables is relatively slow. Data transfer between loop iterations should ideally be done through shift registers. Moving global or local variable read and write operations outside of the loop can save time by reducing the number of reads and writes:
Debug Information
By default, a VI not only contains program code but also necessary data and code for debugging purposes. This supplementary data and code are referred to as debug information.
Debug information is not relevant for programs compiled into executable files or dynamic link libraries (DLLs), as LabVIEW removes the debug information when converting a VI into an executable file. However, a significant portion of programs is distributed to users in .vi file format, to be run within the LabVIEW development environment. In such cases, a considerable part of the computer's resources is used to record intermediate states of the VI's operation for debugging purposes. If there's no need for users to debug these VIs, setting the VI to non-debuggable mode is recommended. This action removes the debug information, potentially reducing CPU time and memory usage by nearly 50%. (For methods to remove debug information, refer to figure 8.5)
Multithreading and Memory Usage
LabVIEW operates with automatic multithreading and automatically manages the allocation and deallocation of memory space for data generated during program execution. This means that, in most cases, LabVIEW generates optimized code. Beginners do not need to concern themselves with threads and memory issues to write safe and efficient programs. However, for programs with higher efficiency requirements, further optimization of thread distribution and memory usage can be achieved by improving certain code sections. These topics will be further explored in the chapters on Memory Optimization and Multithreading Programming.
Utilizing the Time Waiting for User Feedback
Because human reaction speeds are much slower than computer processing speeds, user interface responses are relatively slow. This period can be used to perform useful tasks if needed. For instance, in designing a chess game that involves human-computer interaction, the computer can begin calculating its next move while waiting for the user to make their move. Although this approach does not reduce the computational resources consumed by the program, it can make the program appear to respond more quickly to the user.